


- THE ECB BLOG
Tracking euro area wages in exceptional times
23 May 2024
Negotiated wage growth in the euro area increased in the first quarter of 2024. This post on The ECB Blog illustrates how the ECB wage tracker can help to put latest developments in negotiated wage growth into perspective.
The ECB wage tracker – an important tool used to assess wage developments across the euro area – is signalling that overall wage pressures have moderated since 2023. At the same time wage growth is expected to remain elevated in 2024, and to show a bumpy profile. These developments reflect the staggered nature of the wage adjustment process as workers continue to recoup real wage losses from past price shocks, as well as the important role of one-off payments in this process. Such one-off payments are also behind the increase in euro area negotiated wage growth in the first quarter. This Blog discusses the latest data on wage pressures and the signals for future wage growth from the ECB wage tracker.
Growth in overall wages – which can be measured by compensation per employee (CPE)[1] – has been elevated in the euro area since 2021 and reached 5.2% in 2023, its highest annual rate since the start of the euro. Given the links to inflation – via demand and cost-push channels – wages are closely monitored by central banks. In view of the importance of labour input costs in the services sector, wages are particularly important for services inflation.[2] Services inflation largely reflects domestic inflationary pressures and is tightly linked to wage growth in the medium term, which means that the outlook for wage growth is especially crucial for the domestic inflation outlook.
The increase in wage growth after the pandemic was initially driven primarily by wage drift (Chart 1).[3] Wage drift reflects elements not agreed via collective bargaining, such as individual bonus payments or changes in overtime, and therefore it usually reacts quickly to changes in economic conditions.[4] In the post-pandemic inflation surge, the strong increase in wage drift also reflected ad hoc one-off payments. These are aimed at compensating employees for the increase in inflation that was not expected when the previous wage agreements were reached.[5] While wage drift contributed more than two-thirds (around 3 percentage points) to overall wage growth in 2021, its contribution decreased substantially over 2022 and 2023 to only 0.4 percentage points in the fourth quarter of 2023. This made negotiated wage growth the main driver of more recent overall euro area wage growth.[6]
Chart 1
Decomposition of compensation per employee (CPE) growth in the euro area
(annual percentage changes; p.p. contributions)
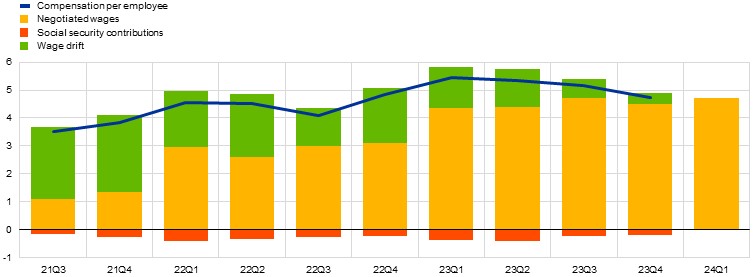
Sources: Eurostat and ECB staff calculations.
Latest observations: 2023 Q4 for CPE and 2024 Q1 for negotiated wages.
As collective wage bargaining in the euro area as a whole covers around 80% of total employees and negotiated wages account for the lion’s share of compensation per employee (CPE), negotiated wage growth is the main determinant of euro area wage developments in the medium term.[7] Given the staggered, infrequent and decentralised nature of wage-setting in euro area countries and the relatively long duration of wage contracts (two years on average), negotiated wage growth reacts only sluggishly to changes in economic conditions and shows a high level of persistence.
Developments in negotiated wages can be monitored by the ECB’s indicator of euro area negotiated wage growth, which has been compiled since 2001 and is based on data from nine countries: Belgium, Germany, Spain, France, Italy, Netherlands, Austria, Portugal and Finland. The indicator is published on a quarterly basis and includes structural wage increases as well as one-off payments.[8] Euro area negotiated wage growth including one-off payments increased from 1.4% in 2021 to 4.5% in 2023 – with inflation catch-up being a central motive in wage negotiations recently. The latest release saw an increase in negotiated wage growth in the first quarter of 2024 to 4.7% – after it slightly moderated from 4.7% in the third quarter of 2023 to 4.5% in the fourth quarter of 2023 (Chart 1). This signals that negotiated wage growth has remained elevated in the euro area. The newly-developed ECB wage tracker can help to interpret these latest signals and put them into perspective.
Interpreting recent developments in negotiated wage growth
The ECB and the National Central Banks have developed a set of wage trackers, which rely on a new euro area database of individual wage agreements for seven euro area countries.[9] These trackers provide timely information on wage growth and they provide forward-looking information on the future wage increases embedded wage settlements, which often cover more than one year. In turn, this forward-looking information provides a leading indicator for future negotiated wage growth developments. Moreover, the trackers are built on granular information that allow for aggregations – for instance, according to the date of the wage agreement or the contract duration – that can provide additional and useful signals for interpreting wage dynamics. The database underlying these trackers is currently updated for each monetary policy meeting of the ECB’s Governing Council and this blog is based on the data available for the most recent Governing Council meeting in April 2024. Later in 2024, key wage tracker indicators for the euro area will be regularly published via the ECB’s data portal.
Chart 2
Wage growth in the euro area - comparing wage trackers and indicator of negotiated wages
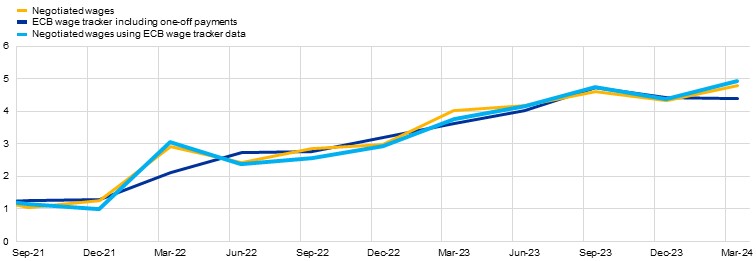
Sources: Eurostat and ECB staff calculations.
Latest observations: 2024 Q1.
Notes: All series shown in the chart include only data from the six countries which are included in both the negotiated wage indicator and the wage tracker: Germany, France, Italy, Spain, the Netherlands and Austria. Wage trackers calculated based on micro data on wage agreements provided by Deutsche Bundesbank, Banco de España, the Dutch employer association (AWVN), Oesterreichische Nationalbank, Banca d’Italia, and Banque de France. The series “Negotiated wages using ECB wage tracker data” records one-off payments in full in the month in which they are disbursed, while the “ECB wage tracker including one-off payments” smooths the impact of one-off payments over a period of 12 months.
Zooming in on latest developments and on the countries for which both the negotiated wage and ECB wage tracker series are available, the ECB’s wage tracker (Chart 2 – dark blue line) moved sideways in the first quarter of 2024 while negotiated wage growth increased (Chart 2 – yellow line). There are differences in methodologies underlying the negotiated wage series and the wage tracker: while the series for negotiated wage growth includes one-off payments in full within the month of disbursement for some countries, the wage tracker smooths the impact of one-off payments over the twelve months after their payment date.[10] Since one-off payments often constitute a compensation for lower structural wage increases, it makes sense to smooth their impact in forward-looking indicators to give a more comprehensive signal about wage pressures.[11] Smoothing reduces the volatility of the wage tracker (especially in monthly frequency) and creates a more reliable picture of the development of overall wage pressures from wage agreements. These differences mean that the two indicators do not always perfectly align: for instance in the first quarter of 2024, when one-off payments in the German public sector played an especially prominent role.[12] However, if we apply a methodology similar to that used to calculate negotiated wage growth, wage tracker data shows very similar developments (Chart 2 – light blue line). Overall, the wage tracker generally correlates closely with negotiated wages and is more timely, meaning that it is a useful leading indicator.
Chart 3
Forward-looking wage tracker for the euro area at different points in time

Sources: Eurostat and ECB staff calculations.
Latest observations: 2023 Q4.
Note: Calculated based on micro data on wage agreements provided by Deutsche Bundesbank, Banco de España, the Dutch employer association (AWVN), Oesterreichische Nationalbank, Bank of Greece, Banca d’Italia and Banque de France. One-off payments are spread over 12 months from the agreed disbursement date - smoothing the impact on wage growth. Coverage reflects the share of euro area employees covered by an active wage agreement that is included in the wage tracker database.
Monitoring the impact of the latest wage agreements on the outlook for negotiated wage growth can be done by comparing vintages of the forward-looking wage tracker for all active wage agreements (Chart 3). These are not forecasts, since they reflect only wage growth in those agreements that have already been reached and are set to remain active for some time into the future. Overall negotiated wage growth will also depend on contracts running out in the future, which will in turn depend on changes in the macroeconomic environment. The forward-looking wage tracker indicates that wage growth is expected to remain relatively elevated and quite bumpy over 2024 – with one-off payments contributing to this bumpiness.
But there have been important changes in recent months. At the time of the December 2023 Governing Council meeting, the average negotiated wage growth for 2024 in all active wage contracts stood at 4.7% (Chart 3 – dotted blue line). By the April Governing Council meeting, the ECB wage tracker included additional information on wage agreements covering around eleven million employees and accounting for around a fifth of the workers covered in our wage tracker. Integrating this additional information suggested lower wage growth of 4.1% on average in all active agreements for 2024 (Chart 3 – dashed blue line). The update for the upcoming Governing Council meeting in June 2024 will include additional information from data that has become available since the April Governing Council. While we expect this profile to change as new data become available, overall, the incoming data suggest that wage pressures from collective agreements have decreased in the euro area since the end of 2023.
Overall, negotiated wage growth is expected to remain elevated in 2024, which is in line with the persistence that has been factored into Eurosystem staff forecasts and reflects the multi-year adjustment process for wages. However, wage pressures look set to decelerate in 2024. ECB wage tracker data for the first few months of the year, when most agreements take place, indicate that negotiated wage pressures are moderating. This is supported by other indicators for wage pressures in the euro area.[13] The Indeed wage tracker based on job postings, which was developed with the Central Bank of Ireland, decreased from its peak of 5.1% in October 2022 to 3.4% in April 2024. Feedback from firms participating in the ECB’s corporate telephone survey in the March 2024 round indicates that companies expect wage growth to decrease from around 5.4% in 2023 to 4.3% in 2024.[14] Similarly, the ECB’s April 2024 Survey on the Access to Finance of Enterprises (SAFE) found that firms expect wages in the euro area to grow by 3.8% on average over the next 12 months – down from 4.5% in the autumn 2023 wave of the SAFE.[15]
The views expressed in each blog entry are those of the author(s) and do not necessarily represent the views of the European Central Bank and the Eurosystem.
CPE is based on national accounts data and the ECB’s main wage growth measure. It is a comprehensive indicator reflecting the labour costs payable by employers (including wages, salaries and employers’ social contributions) expressed as an average per employee.
See for the cost share of wages in services inflation Fagandini, B. et al. (2024): Decomposing HICPX inflation into energy-sensitive and wage-sensitive items, Economic Bulletin, Issue 3, ECB.
Aggregate wage drift is not directly observable and is usually proxied by the difference between the growth rate of gross wages and salaries per employee and the growth rate of negotiated wages.
For details see Koester, G. and Guillochon, J. (2018): "Recent developments in the wage drift in the euro area," Economic Bulletin Issue 8, ECB.
See for details Bodnár, K, Gonçalves, E., Górnicka L. and G. Koester (2022): Wage developments and their determinants since the start of the pandemic, Economic Bulletin, Issue 8, ECB.
CPE growth for the euro area for the first quarter of 2024 is foreseen to be published on 7 June 2024.
See chapter 2 in Gornicka, L. and G. Koester (eds) (2024): “A forward-looking tracker of negotiated wages in the euro area”, Occasional Paper Series, No 338, ECB.
For further details on the indicator of negotiated wages see Kanutin A. (2015), “The ECB’s experimental indicator of negotiated wages”, manuscript available here or Gornicka, L. and G. Koester (eds) (2024): A forward-looking tracker of negotiated wages in the euro area”, Occasional Paper Series, No 338, ECB.
The ECB wage tracker is so far based on data from seven euro area countries (Germany, Spain, France, Italy, Netherlands, Austria and Greece – accounting for around 87% of compensation of employees in the euro area) while the nine countries included in the indicator of negotiated wage growth account for around 94% of compensation of employees in the euro area. The inclusion of additional euro area countries in the euro area wage tracker is on-going. For details see Gornicka and Koester (op cit.) - table 2.
Eurostat also includes one-off payments in full within the month of disbursement when calculating compensation per employee.
These inflation compensation payments have been especially wide-spread and important in Germany – as these were income tax exempt up to 3000 euro per employee over the period from October 2022 to end-2024. By March 2024 more than three-quarters of all employees covered by collective agreements in Germany had received an average inflation compensation payment of €2,761.
Employees in the public sector of the German states received a one-off inflation compensation payment of €1,920 in the first quarter of 2024.
See Disinflation in the euro area: an update speech by Philip R. Lane at the University College Dublin Economics Society; Dublin, 15 April 2024.
Based on simple averages of the quantitative indications provided. For details see: Healy, P., Kuik, F., Morris, R. and M. Slavik (2024)“Main findings from the ECB’s recent contacts with non-financial companies” ECB Economic Bulletin, Issue 3/2024.,
See Survey on the Access to Finance of Enterprises in the euro area – first quarter of 2024.